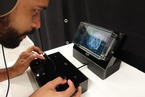
The first MPE2013 exhibition featuring the winner modules of the MPE2013 competition held in collaboration with IMAGINARY takes place from March 5 – 8, 2013 at the UNESCO headquarters in Paris.
Five MPE Experiences
program
Whole Program Folder (zip). To run the program, open index.html in google chrome.
Credits
This program has been prepared for the competition "Mathematics of Planet Earth 2013" by a team from Italy.
Contributors
AuthorsAlessandro Cattaneo, AuthorsFilippo Francesco Favale, AuthorsRiccardo Moschetti
Related Events
This project consists of five different “experiences” related to Mathematics of Planet Earth (MPE): Cartography, Dynamical system, Wator, Temperature and Cellular automata.
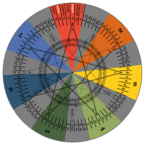
Cartography
This animation shows different ways to project planet Earth on a map. You can trace your own route on the map and see how it looks on the globe. Try to trace the same route with different maps. You can also study two special routes on the globe: the geodesics and the loxodromes.
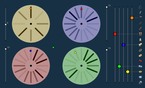
Dynamical SystemThis interactive animation is about the Lotka-Volterra equations; a pair of first-order non-linear differential equations used to describe the evolution of a biological system. That seems difficult. Run the program and click on the graph. You will set an initial datum and see its evolution. Now think that the coordinate “x” is the amount of preys and the coordinate “y” is the amount of predators and try to describe the behaviour of the system.
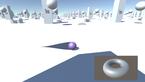
WatorThis interactive animation is about a simulation of a world in which two species of animals live: fishes and sharks. You can choose the number of animals you have at the initial time and the rules they will follow to survive (for example: How long is the life of a fish? When does a shark have a baby?). Click “start” and see how the simulation evolves. Try to get a situation in which sharks and fishes can survive together without becoming extinct.
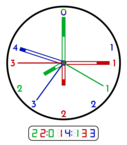
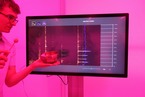
TemperaturesThis interactive animation is about the use of basic statistical analysis. First of all, take a look at the data using “View data”, and try to describe the temperature trend. It is not an easy thing to do, as you can change the scale and the starting point. When you have a large amount of data, you can use means and other statistical tools. Use “Statistics” and try to do it. You will find different behaviours and see that giving prediction is not so easy.
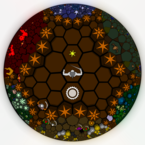
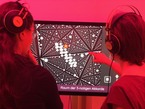
AutomataThis interactive animation can be used to study a linear cellular automaton. You can set the rules and choose the initial data. You will see on the screen the evolution of the automata. You can try to understand how the evolution changes if you change the rules. You will notice that little change in the initial data will give rise to big differences in the evolution.