True 4D graphs of Complex Functions
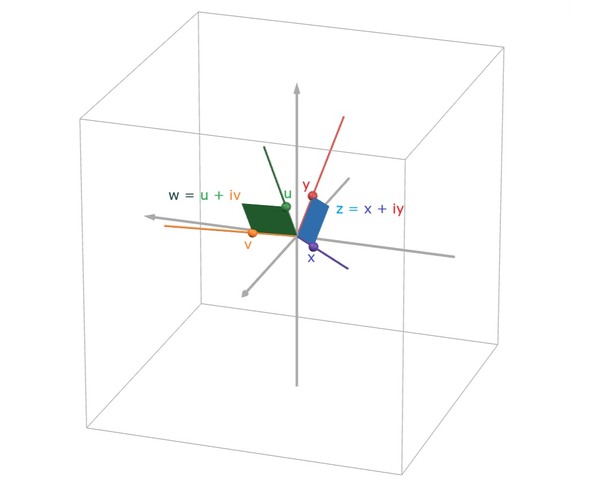
Given complex variables z=x+iy and w=u+iv, a complex function w=f(z) can be rendered visually by a surface in (x,y,u,v) space. Most if not all ‘traditional’ visualisations scratch attempts to visualise 4D from the start (°) and confine themselves to 2D and 3D visualisations, separating z and w variables, omitting the 4th variable, or using colour coding for the 4th.
(°) And yet the tesseract is commonly represented in its ‘full’ 4D appearance, using 4 axes. So, why not complex functions?
Since the 70ies (!) I have been doing ‘true 4D’ graphs of complex functions. Lately I have discovered and used Desmos3D as a generator of the 4D space for them. BTW the 4D rendering method is of course also appropriate for other 4D surfaces than complex functions, and I have included some: Clifford tori, and constituents of the 3-sphere.
This gallery is my first attempt in Imaginary.org to give an impression of how complex functions look like when represented ‘full 4D’. Sorry if the images are not sufficient HD, but I think they’re worth enough to study as such. I’d welcome work on it by others to produce more impressive pictures!
TRUE 4D & 3D Math Contest!
BTW I run a math contest precisely to develop an app doing just that: visualising complex functions full 4D! If you’re a student in EU or Brown University, this may interest you. See in the links for more detail.
About the ‘true’ 4D and 3D method:
https://www. wugi.be/mijndocs/compl-func-visu.4D3D.pdf
About the ‘TRUE 4D and 3D’ math competition:
https://sites. google.com/view/true4d3d-contest
Main webpage:
QB-Complex
Desmos webpage:
Wugi’s DesmoComplex
Youtube channel:
https://www. youtube.com/@wugionyoutube/playlists
| See Desmos file link in description |
4D axes set in Desmos3D
Desmos file: https://www. desmos.com/3d/a4caeed740?lang=nl
(unselect the ‘Circle-Hyperbola w=1/z’ entry to see only the axis system)
| Desmos file see description |
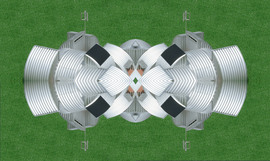
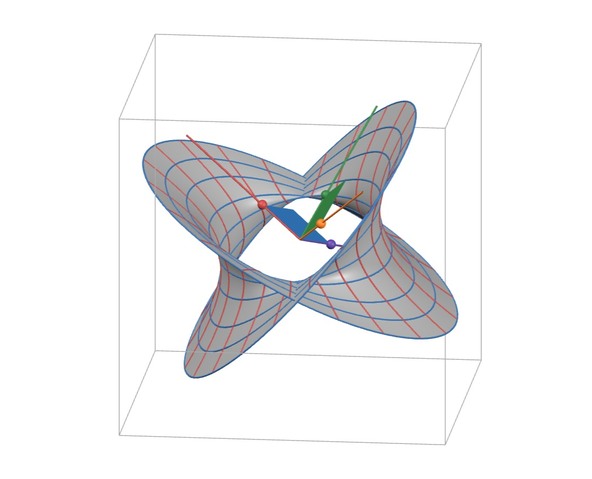
The function w=1/z : a 'Circle-Hyperbola'
Contains the real function u=1/x, a hyperbola.
But as a complex surface it is of the same form (save for a factor of sqrt2) as the surfaces of the functions
z^2 +/- w^2 = +/-1,
ie, (real) circle, hyperbola and imaginary circle equations.
Desmos file: https://www. desmos.com/3d/a4caeed740?lang=nl
| Desmos file: see description |
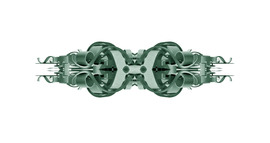
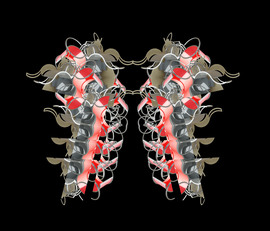
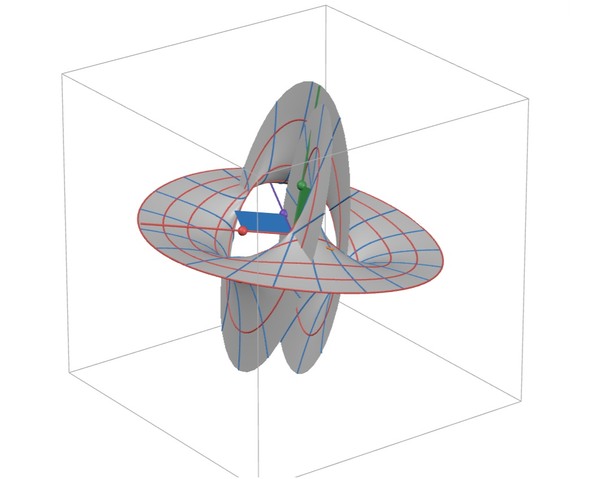
The function w=1/z^2
Simple asymptote (one ‘blade’) w=0, double asymptote (‘double blade’) z=0.
Desmos file: https://www. desmos.com/3d/ccd62239f4?lang=nl
| Desmos file: see description |
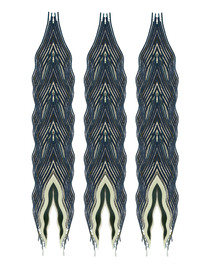
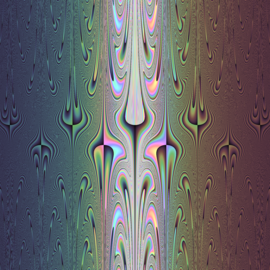
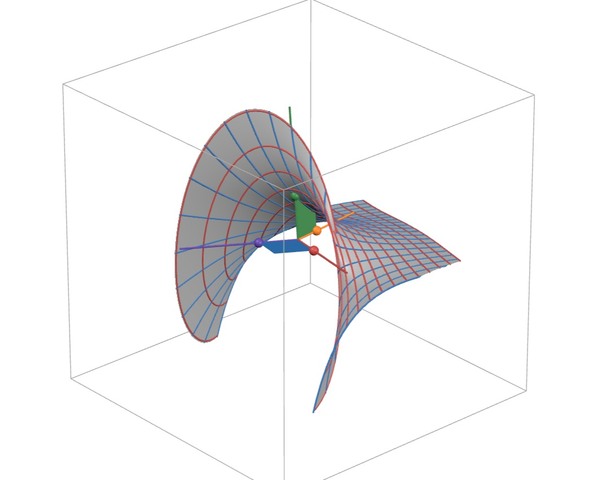
The Exponential w=exp z
One period shown: y=-π to +π. Asymptote for negative x. Exponential ‘blade’ for positive x.
Desmos file: https://www. desmos.com/3d/frvryuwj30?lang=nl
| Desmos file: see description |
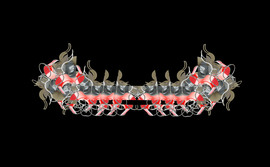
The Cosine w=cos z
One period shown: x=-π to +π.
A combination of a half ‘exponential’ and its inverse (in orange and grey). Both asymptotes disappear, absorbed by the counterparts’ ‘blades’: two opposite blades, joining along the real cosine curve, in red. Other typical curves shown in green on the surface: cosh and sinh.
Desmos file: https://www. desmos.com/3d/q9vhspfqq7?lang=nl
and (other version) https://www. desmos.com/3d/97l2phxgs3?lang=nl
| Desmos file: see description |
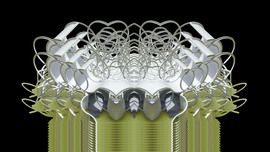
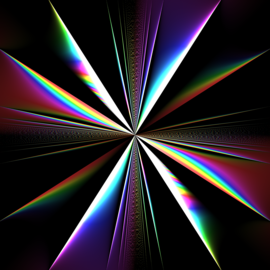
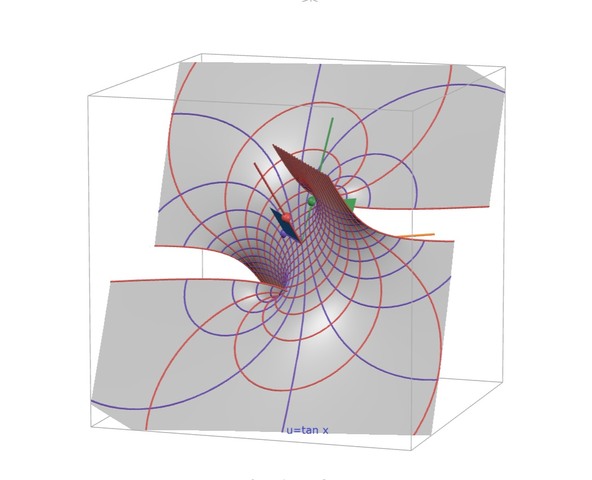
The Tangent w=tan z
One period shown: x=-π/2 to +π/2. Real tangent curve running ‘north-south’ in the middle.
Desmos file: https://www. desmos.com/3d/okfzaouikc?lang=nl
| Desmos file: see description |
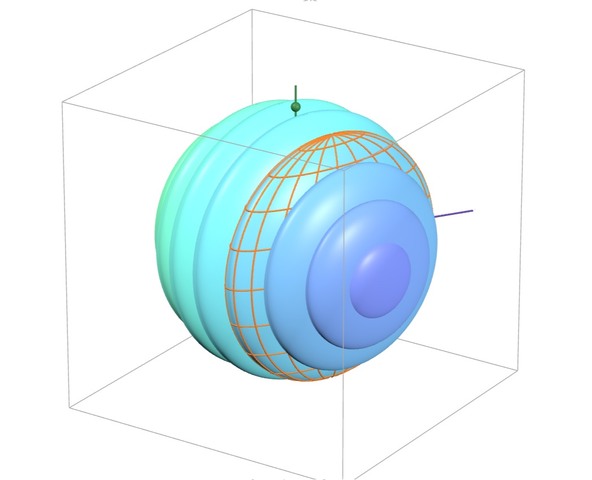
3-Sphere, shown as a stack of growing-shrinking spheres.
Like a circle is generated by growing/shrinking pairs of points along a diameter segment in the 2nd dimension, and
a sphere by growing/shrinking circles along the 3rd dimension, so
the 3-sphere is generated by growing/shrinking spheres along the 4th dimension.
A set of red circles is ‘scanning’ each participating sphare in turns.
Desmos file: https://www. desmos.com/3d/8b9c08d5bd?lang=nl
| Desmos file: see description |
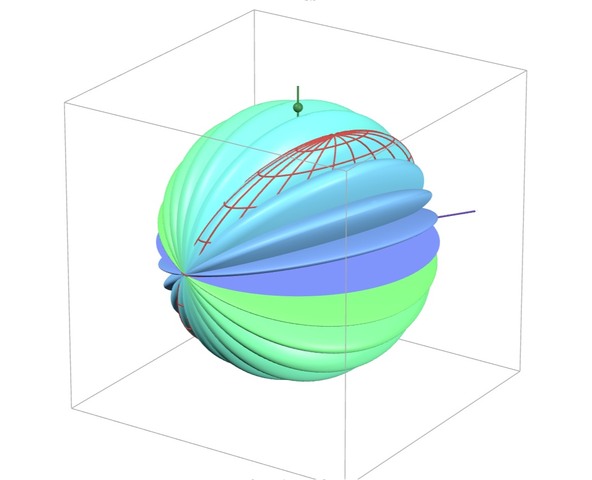
3-Sphere, shown as an 'orange' of rotating spheres.
Like a circle is generated by a rotating pair of points into the 2nd dimension, and
a sphere by a rotating circle into the 3rd dimension, so is
a 3-sphere by a rotating sphere into the 4th dimension.
The picture shows an ‘orange’ of successive positions of the rotating sphere, generating the 3-sphere.
Desmos file: https://www. desmos.com/3d/tbhzomiuk2?lang=nl
| Desmos file: see description |
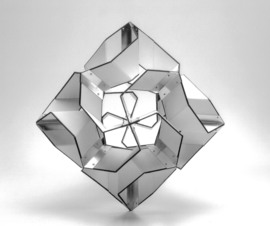
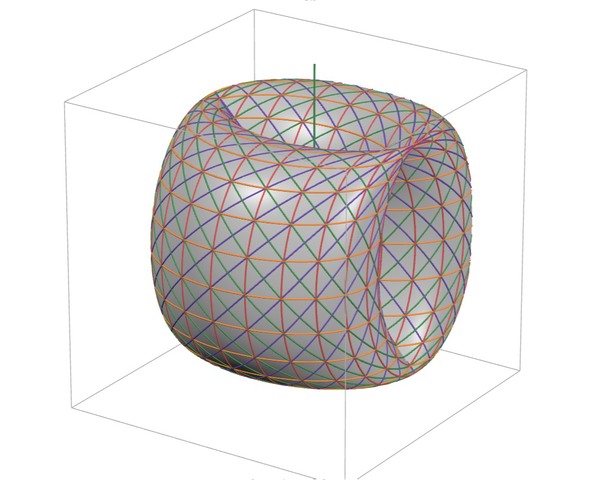
Clifford torus with 4 sets of circles.
The Clifford torus has the equation
(x^2+y^2) = 1/2 =(u^2+v^2)
It has two x two sets of circles: a pair of ‘latitude’ and ‘altitude’ circles, and a pair of so-called ‘Villarceau’ circles.
The former pair is shown as the ‘horizontal and vertical’ ones,
the latter pair as the oblique ones.
Desmos file: https://www. desmos.com/3d/bc50fb564e?lang=nl
(zoom for larger picture)
| Desmos file: see description |
Clifford torus family generating the 3-sphere
The 3-sphere has equation
x^2+y^2+u^2+v^2=1
The Clifford tori have equations
(x^2+y^2) = 1/2-s and (u^2+v^2) = 1/2+s,
with s varying between -1/2 and +1/2.
Thus filling up the 3-sphere’s entire space.
Gif animation for s varying from -1/2 to +1/2 and back.
During the animation the Clifford tori get thinner as the radius of one set of circles in the tori goes shrinking while the radius of the second set increases. The limit case is radius 0 for the former, and radius 1 for the latter: the torus has become a circle belonging to the second set. Then variation inverses, at first toward ‘fatter’ tori, and then goes the opposite way, the first set of circles becoming larger and the second set shrinking. In the limit the torus is again a single circle, now of the first set.
Desmos file: https://www. desmos.com/3d/6f08a335d0?lang=nl
| Desmos file: see description |
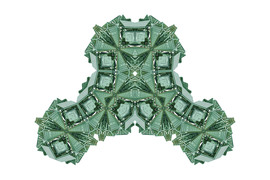
Clifford torus and its Dupin cyclide, rotating
Dupin cyclides (DC) are the 3D result of projecting a (4D) Clifford torus (CT) on to a 3D projection space. Chose a projective point P(0,0,0,v1) on the 4th axis at some location v=v1. Chose a projection space S(x,y,u,v2) at some location v=v2. Project the CT from P on to S. The result is a DC.
If P is chosen so as to touch the CT, then its DC becomes infinite, ie, space filling. Letting the CT rotate results in form changes of the DC: skew.
Our 4D technique allows us to visualise in the same graph the 4D body and its 3D projection!
Desmos file: https://www. desmos.com/3d/pcbrzdugmx?lang=nl
| Desmos file: see description |
Hopf fibration with Clifford tori and Dupin cyclides
The 3-sphere can be generated by Clifford tori (CT), which in turn can be generated by non-intersecting circles. This is called a Hopf fibration: filling up the whole 3-sphere with a family of families of non-intersecting circles.
When looking at the 3D projections of Dupin cyclides (DC), it is the 3D space itself which is filled up.
Here we visualise both the 3-sphere and its 3D projection space being filled up. We use a set of CT and their corresponding DC, increasing their number to the maximum (reaching one limit CT: a circle), then decreasing it, ‘emptying’ 3-sphere and space, reaching the minimum (with only the other limit CT: the other circle).
Desmos file: https://www. desmos.com/3d/saxwtmccqp?lang=nl